Frequency bins

One of the screenshots the ZeoLibrary takes every half hour while i am asleep.
Monitoring and Recording
I use ZeoLibrary to record zeo data over the course of a night. The application shows the current frequency levels and raw brainwave data on top (still need to remove the 60Hz noise), and a recording of the frequency data and sleep-stages from the last half hour at the bottom.
For easy readability i let the software take screenshots every half hour. To analyse the data, i then simply compare the recorded graphs and approximated average values for each of the frequency bins.
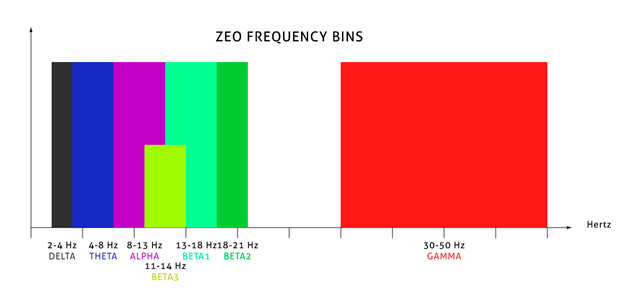
The Zeo Sleep Manager groups recorded brain wave activity into seven frequency bins.
The Frequency Bins
Zeo measures and groups together frequency ranges into 7 so-called bins. The bins are:
- 2-4Hz .... DELTA waves
- 4-8Hz .... THETA waves
- 8-13Hz ... ALPHA waves
- 13-18Hz .. BETA1 waves
- 18-21Hz .. BETA2 waves
- 11-14Hz .. BETA3 waves
- 30-50Hz .. GAMMA waves
The BETA3 bin overlaps in frequency with the ALPHA and BETA1 bin, and seems to be used for specific sleep spindle analysis.
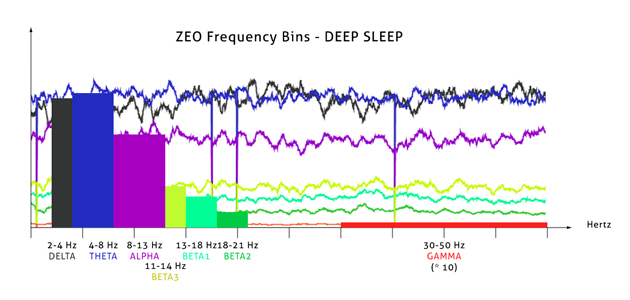
The frequency bin levels during deep sleep.
DEEP Sleep
Deep sleep stands out with the highest DELTA and THETA values. In addition the GAMMA values are very low.
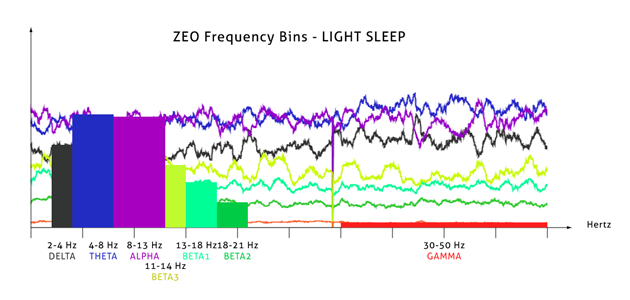
The frequency bin levels during light sleep.
LIGHT Sleep
During light sleep THETA and ALPHA waves are at very similar levels and quite high, while the DELTA waves are considerably lower than in deep sleep.
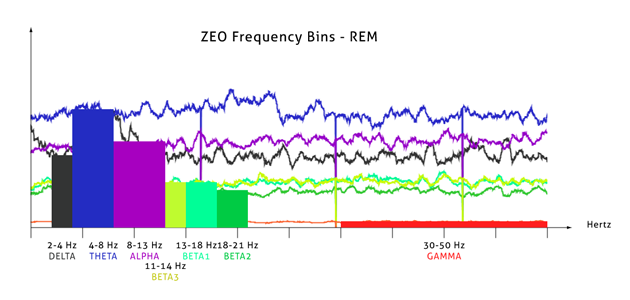
The frequency bin levels during REM sleep.
REM Sleep
In REM sleep, THETA waves are highest and GAMMA waves are slightly higher than in deep and light sleep stages.
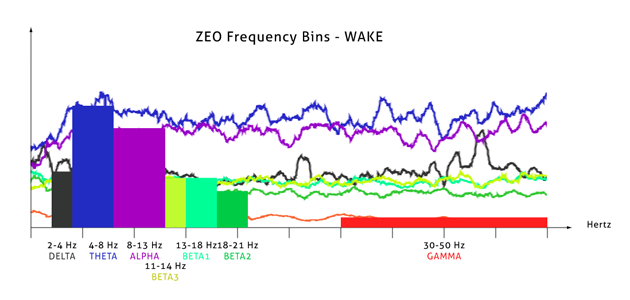
The frequency bin levels during the wake stage.
WAKE Stage
When awake, the GAMMA values are at its highest, and the DELTA values at its lowest level.
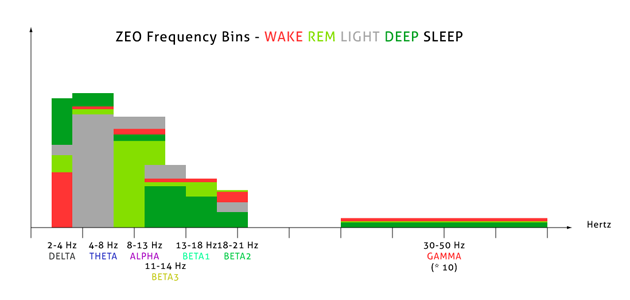
Overlapping display of all 4 sleep (and wake) stages.
All 4 Stages
The images shows all four sleep stages - WAKE, REM, LIGHT and DEEP - as overlapped graphs. It shows that DEEP sleep reaches the highest levels in the low-frequency range, while the WAKE stage reaches the highest levels in the high-frequency range.

The transparent blocks represents the change of level of the frequency bins between the four different sleep stages.
Frequency Fluctuations
The graph on the left shows the change of levels for each frequency bin, over the course of a full night (or full cycle through all sleep stages).
While the THETA, ALPHA and BETA bins all fluctuate for similar amounts, the DELTA bin fluctuate over a range about three times as high. (Fluctuation zones are compared directly by levels, and not as percentage values in relation to each bins maximum value)