More Sleep Graphs
Published in category Research on 2012-08-26Tagged with 2012, data visualization, sleep, zeo, zeolibrary
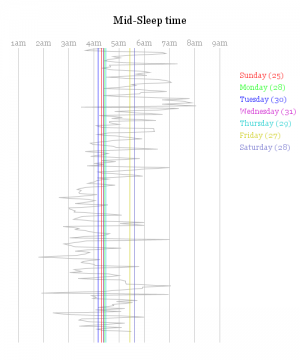
The Mid-Sleep time is halfway between falling asleep and waking up. The graph shows my mid-sleep times for a period of 255 days (i excluded obvious jetlag-days) in grey, and displays the average mid-sleep values for the individual weekdays in color. Weekends obviously haver later mid-sleep points.
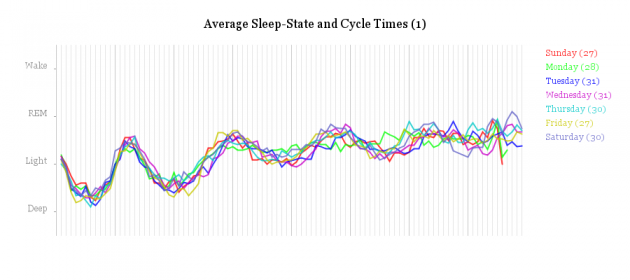
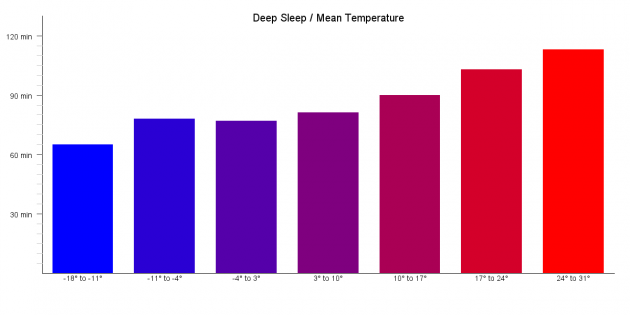
This is an extension of Adventures in Sleeping, and presents more graphs analyzing my sleep data acquired with the Zeo Sleep Manager. Some of the graphs have already been generated with the help of my ZeoLibrary.
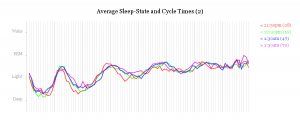
My sleep cycle time averaged over the course of the night, separated into groups based on sleep-onset time.
